If you’ve ever wondered how to use BI tools, you’re about to discover a world where data isn’t intimidating, but powerful and actionable. Business Intelligence (BI) tools help you collect, analyze, and visualize data so you can make informed decisions faster. Whether you’re managing a small team or running a large organization, mastering BI tools can streamline your work, uncover opportunities, and improve results.
In this guide, we’ll walk you through everything from understanding BI tools to building dashboards and sharing insights, in a way that’s easy to follow—even if you’ve never touched a BI tool before.
What Are BI Tools?

BI tools are software platforms that transform raw data into meaningful insights. Imagine having hundreds of spreadsheets, sales reports, and marketing data points scattered across your company. BI tools gather all of that information, organize it, and make it easy to understand through charts, graphs, and dashboards.
Key benefits of BI tools include:
- Data consolidation: Combine data from multiple sources like CRM, Excel sheets, and web analytics.
- Enhanced decision-making: Quickly identify trends, opportunities, and problems.
- Automation: Generate reports automatically, saving time and reducing errors.
- Collaboration: Share insights with team members in real time.
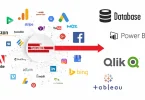
Some popular BI tools beginners often start with are Tableau, Microsoft Power BI, Looker, Qlik Sense, and Google Data Studio.
Step 1: Identify Your Data Sources
Before you can start using BI tools, you need to know where your data lives. Common data sources include:
- CRM systems: Salesforce, HubSpot
- Website analytics: Google Analytics, Adobe Analytics
- Financial data: QuickBooks, Excel, or other accounting tools
- Marketing platforms: Social media analytics, email marketing tools
The key is to understand the type of data each source provides and what insights you hope to gain. This will help you choose the right BI tool and connect your data efficiently.
Step 2: Connect Your Data
Once you know your data sources, the next step is connecting them to your BI tool. Most modern BI platforms provide pre-built connectors for popular databases and software.
Tips for beginners:
- Start with one or two key data sources.
- Make sure you have access permissions for databases or accounts.
- Test the connection to ensure data flows correctly.
For example, if you’re using Power BI, you can connect to Excel, SQL Server, or cloud sources like Azure. If you’re using Tableau, it offers connectors for Google Sheets, Salesforce, and more.
Step 3: Clean and Prepare Your Data
Data cleaning is one of the most critical steps in how to use BI tools. Dirty data leads to inaccurate insights, so it’s essential to remove errors, duplicates, and inconsistencies.
Common data preparation tasks include:
- Removing duplicate records
- Filling missing values
- Standardizing date formats and currency
- Categorizing text fields (e.g., “NY” vs “New York”)
Most BI tools provide drag-and-drop interfaces for cleaning and transforming data, so you don’t need advanced coding skills. Tools like Power BI and Tableau have “Power Query” and “Prep” functions specifically for this purpose.
Step 4: Explore and Analyze Your Data
Once your data is clean, you can start exploring it. This is where the magic happens. BI tools allow you to interact with your data and answer important questions like:
- Which products are performing the best?
- Which marketing channels generate the most revenue?
- How are sales trending month over month?
Beginner-friendly techniques for analysis:
- Filtering: Focus on specific regions, products, or time periods.
- Grouping: Aggregate data by categories like month, department, or customer segment.
- Comparisons: Compare current performance with historical data to spot trends.
- Calculations: Use built-in formulas to calculate percentages, growth rates, or averages.
Interactive features like drill-downs and slicers make it easy to explore data from multiple angles without writing code.
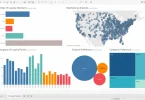
Step 5: Create Visual Dashboards
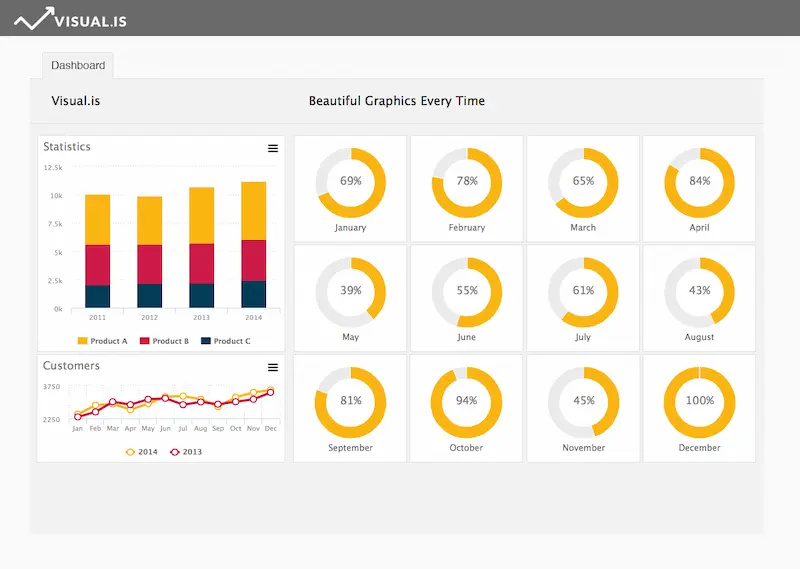
One of the biggest advantages of BI tools is turning numbers into visuals. Dashboards make it easy to understand trends and patterns at a glance.
Tips for effective dashboards:
- Keep it simple: Avoid clutter; focus on key metrics.
- Use visuals wisely: Bar charts for comparisons, line charts for trends, pie charts for proportions.
- Highlight KPIs: Make key performance indicators stand out.
- Interactive elements: Allow users to filter and explore data.
BI tools like Tableau, Power BI, and Looker let you drag and drop charts, apply themes, and customize dashboards to your brand.
Step 6: Share Insights and Collaborate
Insights are only valuable if they reach the right people. Most BI tools make sharing simple:
- Export dashboards as PDF, Excel, or images
- Share live dashboards via the cloud
- Schedule automated reports for stakeholders
Collaboration features also allow teams to comment, discuss, and make data-driven decisions together.
Step 7: Automate Reporting
BI tools shine in their ability to automate reporting. Instead of manually creating weekly or monthly reports, you can:
- Schedule reports to run automatically
- Set alerts for specific KPIs (e.g., sales drop below a threshold)
- Receive notifications when trends change
Automation saves time, ensures accuracy, and keeps everyone in your organization informed.
You may also like to read this:
AI Automation Tools For Beginners – Boost Productivity
Practical AI Solutions For Companies | Boost Efficiency
How AI Improves Business Operations For Smarter Efficiency
Best BI Tools For Beginners: Visualize Data Without Coding
Business Intelligence Tools Comparison: Top BI Platforms
Common Challenges and How to Overcome Them
Even beginners can face hurdles when learning how to use BI tools. Here are some common challenges:
- Too much data: Start small, focus on the most important metrics.
- Data inconsistencies: Clean your data regularly and establish standards.
- Overcomplicated dashboards: Prioritize clarity over complexity.
- Lack of training: Take advantage of tutorials, webinars, and community forums.
Tips for Beginners
- Start with a single dataset and build a simple dashboard.
- Use pre-built templates to save time and learn faster.
- Focus on understanding the story behind the data.
- Regularly update and maintain your data sources.
- Join BI communities or follow online courses to improve your skills.
Conclusion
Learning how to use BI tools may feel overwhelming at first, but with a structured approach, it’s highly achievable. By connecting your data, cleaning it, analyzing trends, creating visual dashboards, and sharing insights, you can make data-driven decisions with confidence.
BI tools aren’t just for large corporations—they’re for anyone who wants to understand their business better. Start small, experiment with dashboards, and soon using BI tools will become a natural part of your workflow.
FAQs on How to Use BI Tools
1. What are BI tools?
Answer: BI (Business Intelligence) tools are software applications that help businesses collect, analyze, and visualize data. They turn raw data from multiple sources into reports, dashboards, and insights for better decision-making. Examples include Tableau, Power BI, Looker, and Qlik Sense.
2. Do I need technical skills to use BI tools?
Answer: Not necessarily. Most modern BI tools are designed with user-friendly, drag-and-drop interfaces. Beginners can start analyzing data and creating dashboards without coding skills. However, basic knowledge of data concepts, like tables and metrics, can be helpful.
3. Which BI tool is best for beginners?
Answer: Popular beginner-friendly BI tools include:
Power BI: Excellent for Microsoft users, easy to learn.
Tableau: Great for interactive visualizations.
Google Data Studio: Free and integrates well with Google products.
The best tool depends on your needs, budget, and data sources.
4. How do I connect data to a BI tool?
Answer: Most BI tools provide built-in connectors to common data sources like Excel, SQL databases, Google Analytics, and cloud apps. You usually just need to authenticate your account and select the dataset you want to use.
5. What is data cleaning, and why is it important?
Answer: Data cleaning is the process of removing errors, duplicates, and inconsistencies from your dataset. Clean data ensures accurate insights, prevents mistakes in reports, and improves decision-making.