In today’s data-driven world, understanding your business metrics is crucial. A business intelligence tools comparison can help you identify which platform will turn your raw data into actionable insights. Business Intelligence (BI) tools help companies visualize data, generate reports, track KPIs, and make informed decisions. But with dozens of BI tools on the market, each claiming to be the best, picking the right one can be overwhelming.
This article will break down top BI tools, compare their features, pricing, pros and cons, and guide you to select the perfect solution for your business.
What Are Business Intelligence Tools?
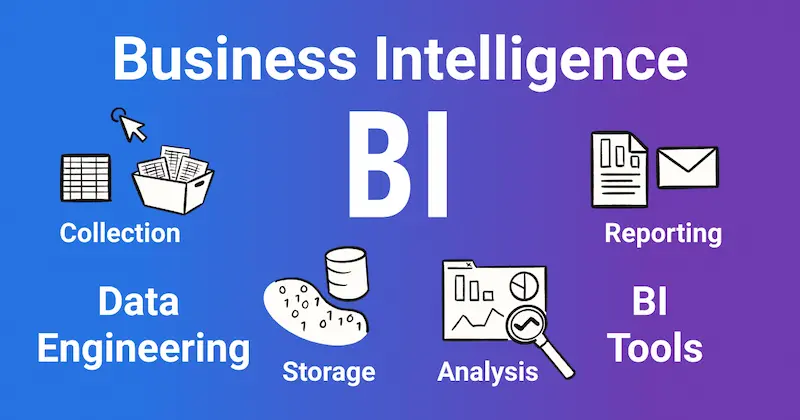
Business intelligence tools are software applications designed to analyze data and support decision-making. These tools help organizations collect, process, and visualize data from multiple sources. They provide insights that can improve operational efficiency, enhance customer satisfaction, and increase revenue.
Key functions of BI tools include:
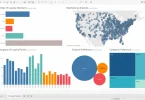
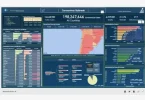
- Data Visualization: Transform complex datasets into charts, graphs, and dashboards.
- Reporting: Generate scheduled and custom reports for team collaboration.
- Data Analytics: Analyze historical and real-time data to identify trends.
- Data Integration: Combine data from multiple sources like CRMs, ERPs, databases, and cloud apps.
- Predictive Analytics: Some advanced BI tools can forecast trends and help in planning strategies.
Why Your Business Needs BI Tools
Even small businesses can benefit from BI tools. Here’s why:
- Better Decision Making: Data-driven decisions reduce guesswork and risk.
- Enhanced Efficiency: Automated dashboards and reports save time.
- Trend Identification: Spot sales, marketing, or operational trends quickly.
- Improved Customer Insights: Understand customer behavior and preferences.
- Competitive Advantage: Make informed decisions faster than competitors.
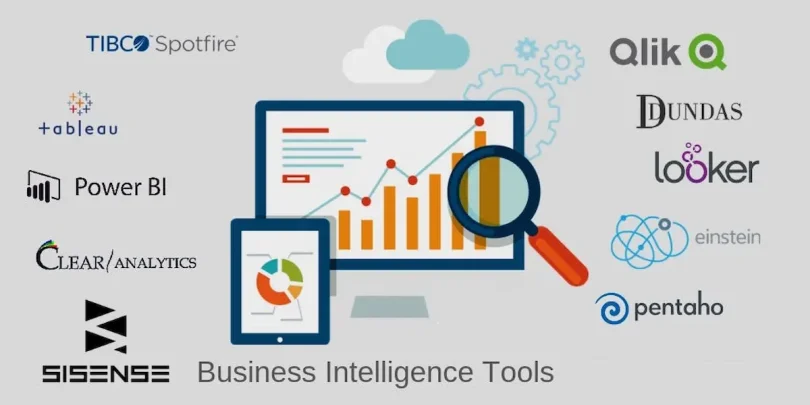
Detailed Business Intelligence Tools Comparison

Here’s an in-depth business intelligence tools comparison of the top platforms available in 2026:
1. Tableau
Overview: Tableau is one of the most popular BI tools globally, known for its interactive and visually appealing dashboards.
- Key Features:
- Drag-and-drop interface
- Interactive dashboards and charts
- AI-driven analytics
- Mobile-friendly reports
- Drag-and-drop interface
- Pros:
- Highly intuitive visualizations
- Strong user community and resources
- Wide range of integrations
- Highly intuitive visualizations
- Cons:
- Can be expensive for small businesses
- Complex for advanced analytics
- Can be expensive for small businesses
- Pricing: Starts at $70/user/month (Tableau Creator)
- Best For: Organizations needing highly interactive, visually engaging dashboards
2. Microsoft Power BI
Overview: Power BI integrates seamlessly with Microsoft products, making it ideal for businesses already using Microsoft 365.
- Key Features:
- Real-time dashboards
- Built-in AI analytics
- Integration with Excel, Azure, and Teams
- Customizable reports and visualizations
- Real-time dashboards
- Pros:
- Cost-effective compared to other BI tools
- Easy to learn for Microsoft users
- Strong community support
- Cost-effective compared to other BI tools
- Cons:
- Limited customization compared to Tableau
- Requires technical knowledge for complex datasets
- Limited customization compared to Tableau
- Pricing: Free version available; Pro version at $9.99/user/month
- Best For: Microsoft ecosystem users and small to medium-sized businesses
3. Qlik Sense
Overview: Qlik Sense uses an associative data engine to help users explore data from multiple angles.
- Key Features:
- Self-service analytics
- Smart visualizations
- Predictive analytics and AI-powered insights
- Integration with cloud and on-premise data sources
- Self-service analytics
- Pros:
- Powerful analytics for complex datasets
- Highly interactive dashboards
- Strong data integration capabilities
- Powerful analytics for complex datasets
- Cons:
- Higher pricing than Power BI
- Steeper learning curve
- Higher pricing than Power BI
- Pricing: Starts at $30/user/month (Professional)
- Best For: Organizations handling complex and large datasets
4. Looker
Overview: Looker, now part of Google Cloud, focuses on cloud-based data exploration and analytics.
- Key Features:
- SQL-based modeling
- Cloud-native analytics
- Data exploration and visualization
- Embedded analytics for applications
- SQL-based modeling
- Pros:
- Excellent for cloud-based businesses
- Customizable data models
- Strong collaboration features
- Excellent for cloud-based businesses
- Cons:
- Requires SQL knowledge
- Less visually rich compared to Tableau
- Requires SQL knowledge
- Pricing: Contact vendor for enterprise pricing
- Best For: Data teams comfortable with SQL and cloud analytics
5. Sisense
Overview: Sisense is designed for embedding analytics into applications and handling large-scale datasets.
- Key Features:
- AI-powered insights
- Embedded analytics
- Real-time dashboards
- Data mashup from multiple sources
- AI-powered insights
- Pros:
- Handles very large datasets efficiently
- Strong AI and predictive analytics
- Flexible deployment options
- Handles very large datasets efficiently
- Cons:
- Interface less intuitive than competitors
- Pricing varies based on data volume
- Interface less intuitive than competitors
- Pricing: Contact vendor for enterprise pricing
- Best For: Large organizations with complex, high-volume data requirements
You may also like to read this:
Best AI Tools For Productivity | Work Smarter With AI
AI Automation Tools For Beginners – Boost Productivity
Practical AI Solutions For Companies | Boost Efficiency
How AI Improves Business Operations For Smarter Efficiency
Best BI Tools For Beginners: Visualize Data Without Coding
How to Choose the Right BI Tool
When comparing BI tools, consider:
- Business Needs: Determine if you need reporting, visualization, or predictive analytics.
- Data Sources: Check if the tool integrates with your CRM, ERP, and other software.
- Budget: Compare pricing plans, including hidden costs like training or extra licenses.
- User Skill Level: Choose a tool that your team can easily adopt.
- Scalability: Ensure the tool can grow with your business and handle increasing data volume.
Tips for Getting the Most Out of BI Tools
- Invest in Training: Proper training ensures your team can use the tool effectively.
- Start with Key Metrics: Focus on critical KPIs first before expanding dashboards.
- Automate Reporting: Schedule automated reports for managers and stakeholders.
- Use Dashboards Wisely: Make dashboards actionable, not just pretty charts.
- Regularly Review: Keep your analytics updated with fresh data for accurate insights.
Conclusion
A detailed business intelligence tools comparison is essential for selecting the right BI platform for your organization. Whether you prioritize interactive dashboards, cost-effectiveness, cloud integration, or advanced analytics, the right tool can transform your business by turning data into actionable insights. Investing time in evaluating these platforms ensures you make smarter decisions and stay ahead in today’s competitive market.
FAQs
Q1: Are BI tools suitable for small businesses?
Yes, tools like Power BI and Tableau Public are cost-effective for small teams.
Q2: Do BI tools require technical skills?
Many tools offer drag-and-drop interfaces, but SQL or data analytics knowledge helps with advanced features.
Q3: Can BI tools handle real-time data?
Yes, most modern BI tools, including Power BI and Qlik Sense, offer real-time analytics.
Q4: Should I choose cloud-based or on-premise BI?
Cloud BI is flexible and scalable, ideal for remote teams. On-premise BI may be preferred for strict data security.