In today’s fast-paced business world, every decision counts. But how do you make smart decisions when your company is generating mountains of data every day? That’s where BI reporting tools for business come in. These tools help you transform raw data into actionable insights, so you can see trends, monitor performance, and make data-driven decisions confidently.
Whether you’re running a small business or managing a large enterprise, understanding and using BI reporting tools can give you a competitive edge.
What Are BI Reporting Tools?
BI (Business Intelligence) reporting tools are software solutions designed to collect, process, analyze, and visualize data from multiple sources. Simply put, they take complex data — from sales, marketing, finance, customer behavior, and more — and turn it into reports and dashboards that are easy to understand and act upon.
For example, instead of manually calculating monthly sales growth from Excel spreadsheets, a BI reporting tool can automatically generate a dashboard showing sales trends, top-performing products, and regional performance — all in real time.
Why Businesses Need BI Reporting Tools
Using BI reporting tools for business isn’t just a trend — it’s becoming essential for survival. Here’s why:
- Faster, Data-Driven Decisions
BI tools allow decision-makers to quickly access accurate information. Instead of waiting for manual reports, managers can see up-to-date metrics and respond immediately to market changes. - Efficiency and Time Savings
Automating reporting reduces manual work, minimizes human errors, and frees up employees to focus on strategic initiatives rather than data crunching. - Better Performance Tracking
BI tools help track KPIs across departments. From sales and marketing to operations and HR, you can see which areas are performing well and where improvements are needed. - Improved Collaboration
Dashboards and reports can be shared across teams, ensuring everyone is aligned and making decisions based on the same data. - Competitive Advantage
Businesses that leverage BI tools can spot trends, forecast outcomes, and optimize operations faster than competitors relying on static reports or gut feeling.
Key Features of BI Reporting Tools
When choosing BI reporting tools for business, consider these essential features:
- Data Integration: Ability to connect to multiple sources such as databases, spreadsheets, CRMs, ERP systems, cloud storage, and social media platforms.
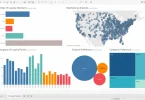
- Interactive Dashboards: Dynamic dashboards allow users to explore data by drilling down into specific metrics.
- Custom Reporting: Tailor reports to your organization’s unique KPIs, timeframes, or departments.
- Data Visualization: Graphs, charts, heatmaps, and maps make complex data visually understandable.
- Real-Time Analytics: Provides live insights to respond quickly to opportunities or problems.
- Security and Access Control: Protect sensitive data with user permissions and secure access.
- Predictive Analytics: Some BI tools use AI to forecast trends and outcomes, helping you plan ahead.
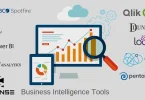
Popular BI Reporting Tools for Business
Here’s a detailed look at some of the most popular BI reporting tools that businesses rely on:
1. Tableau
- Strengths: Stunning visualizations, drag-and-drop interface, strong analytics capabilities.
- Best For: Organizations focused on visual data storytelling and detailed insights.
- Use Case: Marketing teams can track campaign performance in real time with interactive dashboards.
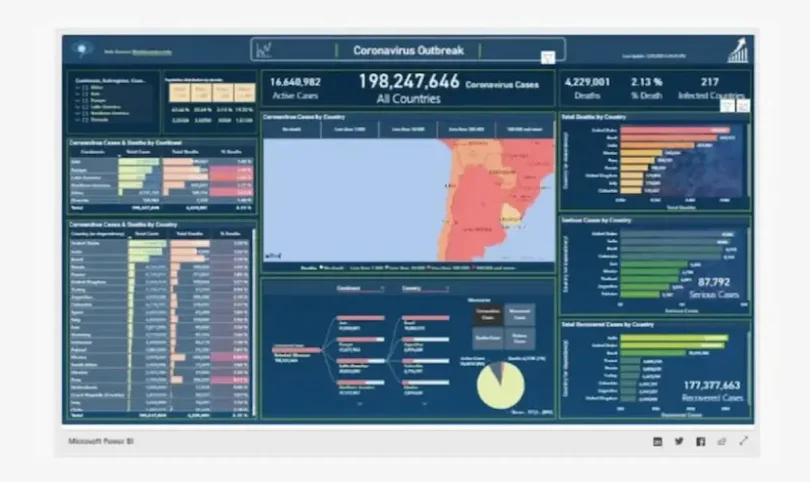
2. Power BI
- Strengths: Integration with Microsoft Office, cost-effective, easy to use.
- Best For: Businesses already using Microsoft tools like Excel, Azure, and Teams.
- Use Case: Finance teams can create automated financial reports connecting multiple Excel sheets.
3. Qlik Sense
- Strengths: Associative data modeling allows users to explore relationships in data.
- Best For: Businesses that need flexible, exploratory analytics.
- Use Case: Retail companies can analyze sales across stores, products, and regions simultaneously.
4. Looker
- Strengths: Cloud-based, real-time analytics, Google Cloud integration.
- Best For: Businesses leveraging cloud data storage and requiring scalable analytics.
- Use Case: E-commerce companies can track customer behavior and conversion rates in real time.
5. Sisense
- Strengths: Embeddable analytics, handles large datasets efficiently.
- Best For: Companies needing BI capabilities integrated into internal apps or client-facing platforms.
- Use Case: SaaS platforms embedding analytics dashboards directly for their clients.
You may also like to read this:
Practical AI Solutions For Companies | Boost Efficiency
How AI Improves Business Operations For Smarter Efficiency
Best BI Tools For Beginners: Visualize Data Without Coding
Business Intelligence Tools Comparison: Top BI Platforms
How To Use BI Tools: Beginner’s Step-By-Step Guide
How to Implement BI Reporting Tools in Your Business
Implementing a BI reporting tool doesn’t have to be overwhelming. Follow these steps for a smooth rollout:
- Identify Your Goals
Start with what you want to achieve: monitor sales growth, improve marketing ROI, reduce operational costs, or enhance customer experience. - Choose the Right Tool
Consider your business size, technical expertise, budget, and existing software ecosystem. Trial versions can help you evaluate which tool fits best. - Gather and Connect Your Data Sources
Identify where your data resides — databases, CRMs, ERP systems, cloud apps — and integrate them with your BI tool. - Design Dashboards and Reports
Start with key metrics for your team, such as revenue trends, customer engagement, or inventory levels. Keep dashboards simple and actionable. - Train Your Team
Even the most powerful tool is useless if employees don’t know how to use it. Offer training sessions or tutorials for your staff. - Monitor, Review, and Optimize
Regularly review dashboards and reports. Update them as business needs change and ensure they continue to deliver valuable insights.
Benefits of Using BI Reporting Tools for Small Businesses
Many think BI tools are only for large enterprises, but small businesses can benefit immensely:
- Affordable Options: Tools like Power BI and Google Data Studio offer free or low-cost versions.
- Quick Insights: Small teams can instantly see sales trends, customer preferences, or website analytics.
- Scalability: BI tools grow with your business, from a few dashboards to complex, enterprise-level analytics.
FAQs About BI Reporting Tools for Business
Q1: Can BI reporting tools help reduce costs?
Yes. By identifying inefficiencies, optimizing operations, and forecasting trends, BI tools help businesses save money.
Q2: Are BI tools only for technical users?
Not anymore. Modern BI tools have user-friendly interfaces, drag-and-drop dashboards, and templates suitable for non-technical users.
Q3: How long does it take to implement a BI tool?
It depends on the complexity and number of data sources. Basic dashboards can be up and running in a few weeks; full-scale enterprise integration may take a few months.
Q4: Is cloud-based BI better than on-premise?
Cloud-based BI offers flexibility, easier updates, and scalability. On-premise may be preferred for highly sensitive data or regulatory requirements.
Conclusion
In a world driven by data, using BI reporting tools for business is essential for survival and growth. They transform complex datasets into actionable insights, enable faster decision-making, improve efficiency, and provide a competitive advantage. Whether you are a small business owner looking to optimize operations or a manager in a large enterprise tracking KPIs across departments, BI reporting tools are a must-have.
Start with your most important metrics, choose the right tool, and gradually expand your analytics capabilities. Your data has a story to tell — let BI tools help you read it.