If you’re just starting your journey in the world of data, you might be wondering, “What are the best data analytics tools for beginners?” Don’t worry—data analytics isn’t as complicated as it sounds. With the right tools and guidance, anyone can analyze data, uncover insights, and make smarter decisions. In this detailed guide, we’ll cover the most beginner-friendly tools, explain why they’re useful, and give you tips to start using them today.
Why Data Analytics Tools Are Essential for Beginners

Before diving into the tools, it’s important to understand why they matter. Data analytics tools help you:
- Organize and Clean Data: Raw data is messy. Tools like Excel or Python help you sort, filter, and clean data efficiently.
- Visualize Data: Charts, graphs, and dashboards make it easier to identify patterns and trends.
- Make Data-Driven Decisions: Analytics helps you move beyond guesswork and make decisions based on evidence.
- Save Time: Automation features in these tools reduce repetitive tasks, letting you focus on insights.
- Collaborate with Teams: Cloud-based tools like Google Sheets allow multiple users to work on the same data simultaneously.
Think of analytics tools as your “data assistant.” They simplify complex tasks and make it easier to understand the story behind your data.
Essential Data Analytics Tools for Beginners
Here’s a detailed look at beginner-friendly data analytics tools, along with practical tips and examples.
1. Microsoft Excel
Why it’s great: Excel is the most widely used tool for data analysis, and its interface is beginner-friendly. Even if you’ve never analyzed data before, Excel’s formulas and functions allow you to perform powerful calculations.
Key Features for Beginners:
- Pivot Tables: Summarize large datasets quickly.
- Charts & Graphs: Visualize trends and patterns easily.
- Functions: Basic formulas like SUM, AVERAGE, COUNTIF, and VLOOKUP.
Example: Suppose you have sales data for a store. With pivot tables, you can quickly calculate total sales per product category or per month.
Tip: Start by practicing with sample datasets from Kaggle or online tutorials. Learn formulas first, then move to charts and pivot tables.
2. Google Sheets
Why it’s great: Google Sheets is cloud-based, free, and allows real-time collaboration. You don’t need to install anything, and your data is always saved online.
Key Features for Beginners:
- Functions: Similar to Excel, with formulas for calculations.
- Filters & Conditional Formatting: Highlight trends in your data.
- Integration: Works with Google Data Studio for advanced visualization.
Example: Track your expenses in Google Sheets and use charts to visualize your monthly spending trends.
Tip: Use built-in templates like “Annual Budget” or “Project Tracker” to practice analyzing and visualizing data.
3. Tableau
Why it’s great: Tableau is one of the most popular data visualization tools in the world. It allows beginners to create interactive dashboards without coding.
Key Features for Beginners:
- Drag-and-drop interface for creating charts.
- Real-time dashboards with filters and interactivity.
- Connects to multiple data sources like Excel, SQL, and Google Sheets.
Example: Create a sales dashboard showing revenue by region, product, and month with just a few clicks.
Tip: Start with Tableau Public (free version) and practice by importing small datasets. Focus on understanding charts before creating complex dashboards.
4. Power BI
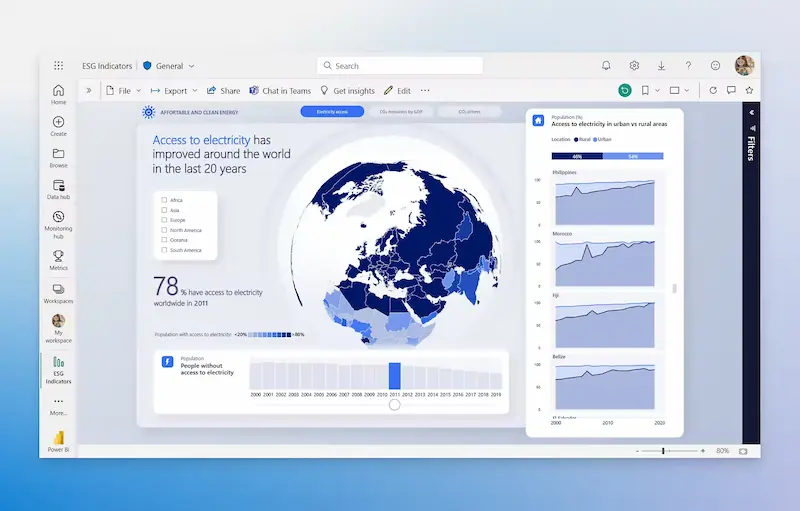
Why it’s great: Power BI is Microsoft’s analytics platform, similar to Tableau, but integrates seamlessly with Excel and other Microsoft products.
Key Features for Beginners:
- Connect to multiple data sources easily.
- Build dashboards and reports with visual drag-and-drop tools.
- Advanced analytics with built-in AI features.
Example: A marketing analyst can use Power BI to track campaign performance, website traffic, and social media engagement in one dashboard.
Tip: Begin with Power BI Desktop (free) and explore basic visuals like bar charts, pie charts, and maps. Gradually learn filters and slicers.
5. Python (with Pandas & Matplotlib)
Why it’s great: Python is beginner-friendly and widely used in data analytics and data science. Libraries like Pandas and Matplotlib allow you to clean, manipulate, and visualize data easily.
Key Features for Beginners:
- Pandas: Handle datasets, perform calculations, filter and clean data.
- Matplotlib & Seaborn: Create visualizations like line charts, bar charts, and heatmaps.
- Automation: Process large datasets without manual work.
Example: Import a CSV file of sales data into Python, calculate total revenue per month, and create a bar chart showing trends.
Tip: Start with simple exercises: read a CSV file, calculate averages, and plot basic charts. Gradually move to more complex data analysis projects.
6. R Programming
Why it’s great: R is specifically designed for statistical analysis and is beginner-friendly for those interested in data science and predictive modeling.
Key Features for Beginners:
- Statistical analysis functions built-in.
- ggplot2 for powerful data visualizations.
- Great for analyzing surveys, experiments, or research datasets.
Example: Analyze a dataset of customer feedback to calculate satisfaction scores and visualize trends.
Tip: Use RStudio as your IDE, start with basic statistical functions, and create visualizations with ggplot2.
7. Google Data Studio
Why it’s great: This is a free visualization tool that turns data from Google Sheets, Google Analytics, or other sources into interactive dashboards.
Key Features for Beginners:
- Drag-and-drop charts and graphs.
- Interactive dashboards with filters.
- Easy sharing and collaboration.
Example: Connect Google Analytics data to Data Studio to create a report showing website traffic, top pages, and user behavior.
Tip: Start with simple reports and gradually add multiple charts and filters for interactivity.
You may also like to read this:
Learn Data Analytics For Beginners: Easy Tips And Tools
Complete Basic Data Analytics Tutorial To Learn Data Easily
How To Start Data Analytics | Beginner-Friendly Guide 2026
Simple Data Analysis Techniques For Beginners | Easy Guide
How to Choose the Right Tool for You
With so many options, beginners often wonder which tool to pick. Here’s a simple approach:
- Start Small: Begin with Excel or Google Sheets to understand basic analytics.
- Focus on Visualization: If you want to create dashboards, Tableau or Power BI are great.
- Programming Skills: If you want advanced analytics, choose Python or R.
- Budget: Many beginner-friendly tools are free or have free versions—start there.
- End Goal: Business analysis? Go for Power BI or Tableau. Learning programming? Python or R is ideal.
Tips for Beginners to Learn Data Analytics Effectively
- Practice with Real Data: Use datasets from Kaggle, Google Dataset Search, or public datasets from governments.
- Take Small Steps: Learn functions and charts first, then dashboards, then automation.
- Experiment: Don’t be afraid to try different charts, formulas, or scripts. Mistakes are part of learning.
- Use Tutorials: Many free tutorials exist online for Excel, Python, R, Tableau, and Power BI.
- Join Communities: Forums like Reddit, Stack Overflow, and LinkedIn groups help when you’re stuck.
FAQs About Data Analytics Tools for Beginners
Q1: Do I need to know coding for data analytics?
No, beginners can start with Excel, Google Sheets, Tableau, or Power BI. Coding with Python or R is optional but useful for advanced analytics.
Q2: Which tool is easiest to learn?
Excel and Google Sheets are the easiest. They are beginner-friendly and widely used in business.
Q3: Can beginners use Python or R?
Yes! Start with simple tasks like reading data, basic calculations, and creating charts. Gradually move to complex analytics.
Q4: Are these tools free?
Google Sheets, Python, R, and Google Data Studio are free. Excel, Tableau, and Power BI have free versions with limited features.
Q5: How long does it take to learn a tool?
Basic proficiency can take a few weeks with regular practice. Mastery depends on how complex your projects are.
Conclusion
Learning data analytics tools for beginners is easier than you think. Start with Excel or Google Sheets to understand data basics, move on to visualization tools like Tableau or Power BI, and explore Python or R for programming-based analysis. With practice, patience, and curiosity, you’ll be able to turn raw data into actionable insights.
Remember, every expert started as a beginner. The key is to start today, practice regularly, and gradually explore more advanced tools. Soon, analyzing data will feel like second nature!