If you’re curious about how businesses make smart decisions or how trends are predicted, a data analytics learning guide is your starting point. Data analytics is more than just working with numbers—it’s about uncovering meaningful insights from raw data, which can influence decisions in marketing, finance, healthcare, operations, and many other fields.
This guide will help you learn data analytics in a structured, easy-to-follow way, whether you’re a complete beginner or looking to improve your existing skills.
What Is Data Analytics?
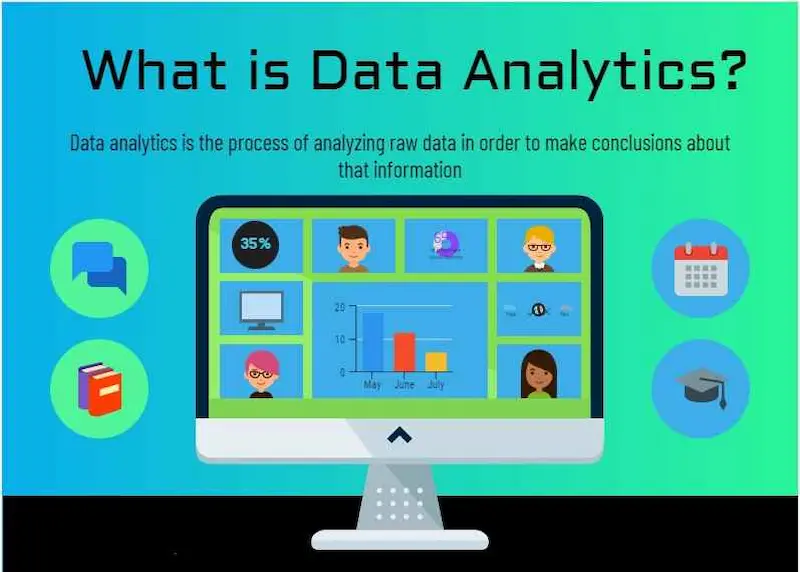
Data analytics is the science of examining raw data to identify trends, patterns, and insights. Think of it as a process that transforms data into actionable knowledge. For instance, a retail store may analyze customer purchase history to predict what products will sell best in the next season.
Types of Data Analytics
- Descriptive Analytics – This answers “What happened?”
Example: Monthly sales reports showing revenue trends. - Diagnostic Analytics – This answers “Why did it happen?”
Example: Investigating why sales dropped in a particular month. - Predictive Analytics – This answers “What could happen?”
Example: Predicting future customer buying behavior using historical data. - Prescriptive Analytics – This answers “What should we do?”
Example: Suggesting optimal inventory levels to maximize profit.
Understanding these types helps you frame the right questions when working with data.
Why You Should Follow a Data Analytics Learning Guide
Data analytics is no longer limited to data scientists. Professionals across industries are leveraging data to improve decision-making. A structured data analytics learning guide can help you:
- Start step-by-step without feeling overwhelmed.
- Learn practical tools and techniques used in real-world projects.
- Build skills that are highly valued in today’s job market.
Step-by-Step Learning Path for Data Analytics
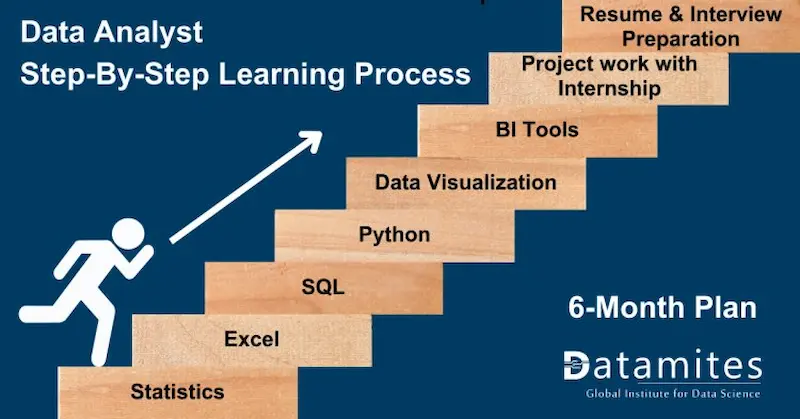
Here’s a detailed roadmap to help you learn data analytics effectively.
1. Start With the Basics
Before diving into tools, understand the foundational concepts:
- Data Types: Structured (Excel tables, databases) vs. unstructured (emails, social media posts).
- Key Statistical Concepts: Mean, median, mode, standard deviation, correlation.
- Business Understanding: How data relates to business problems.
Tip: Practice calculating mean, median, and mode on sample datasets to understand their significance.
2. Learn Data Visualization
Data visualization turns complex numbers into understandable insights. Visuals help businesses and stakeholders quickly grasp patterns. Start with beginner-friendly tools and gradually move to advanced ones:
- Excel: Great for charts, pivot tables, and basic dashboards.
- Tableau: Allows interactive dashboards and advanced visual storytelling.
- Power BI: Ideal for business reporting and real-time dashboards.
Tip: Try creating a sales trend chart in Excel and then recreate it in Tableau to see the differences.
3. Master Data Cleaning and Preparation
Raw data is often messy, and cleaning it is a critical step before analysis:
- Handling Missing Values: Replace missing numbers with averages or medians.
- Removing Duplicates: Ensure each record is unique to prevent bias.
- Standardizing Data: Convert dates, currencies, and text formats consistently.
Example: If a dataset has multiple formats for dates, standardize them to “YYYY-MM-DD” to make analysis easier.
You may also like to read this:
Learn Data Analytics For Beginners: Easy Tips And Tools
Complete Basic Data Analytics Tutorial To Learn Data Easily
How To Start Data Analytics | Beginner-Friendly Guide 2026
Data Analytics Tools For Beginners | Complete Guide
Simple Data Analysis Techniques For Beginners | Easy Guide
4. Learn Core Data Analytics Tools
Hands-on experience with tools is essential:
- SQL: Learn to query databases and extract useful information.
- Python or R: Useful for advanced analytics, statistical modeling, and machine learning.
- Google Analytics: Useful for web and marketing analytics.
- Excel / Power BI / Tableau: Visualization and reporting.
Tip: Practice by building small projects like a dashboard for a mock company’s sales data.
5. Understand Data Analysis Techniques
Some common techniques used in data analytics include:
- Trend Analysis: Identifying patterns over time.
- Regression Analysis: Predicting relationships between variables.
- Segmentation: Grouping data into meaningful categories.
- Hypothesis Testing: Validating assumptions with statistical tests.
Example: Segment customers by purchasing frequency to design personalized marketing campaigns.
6. Work on Real-World Projects
The best way to learn is by doing. Start small and gradually take on more complex projects:
- Analyze historical sales data to identify peak seasons.
- Predict customer churn using machine learning algorithms.
- Build interactive dashboards showing KPIs for a department.
- Analyze social media data to find trends and engagement patterns.
Tip: Create a portfolio of your projects—it’s a powerful way to showcase skills to potential employers.
7. Keep Learning and Staying Updated
Data analytics is a rapidly evolving field. To stay ahead:
- Follow analytics blogs and industry leaders.
- Take online courses on platforms like Coursera, Udemy, or LinkedIn Learning.
- Participate in hackathons and Kaggle competitions.
Tip: Even small daily practice sessions will improve your skills over time.
Common Challenges and How to Overcome Them
- Feeling Overwhelmed: Focus on one tool or concept at a time.
- Too Many Tools to Learn: Start with Excel or SQL, then gradually explore Python, R, Tableau, or Power BI.
- Understanding Statistics: Apply concepts to real datasets instead of memorizing formulas.
- Data Quality Issues: Always check for missing or inconsistent data before starting analysis.
FAQs: Data Analytics Learning Guide
Q1: How long will it take to learn data analytics?
A: It varies, but consistent practice can give beginners a strong foundation in 3–6 months.
Q2: Do I need programming skills?
A: Not initially. Excel and Tableau are beginner-friendly, but Python or R is helpful for advanced analysis.
Q3: Can I get a data analytics job without a degree?
A: Yes. Skills, certifications, and a portfolio of projects can help you land a role.
Q4: What’s the best way to practice data analytics?
A: Work on real datasets from platforms like Kaggle, or create mock projects using sample data.
Conclusion
Following a data analytics learning guide is your first step toward a rewarding career. By understanding the basics, mastering essential tools, practicing with real-world datasets, and continuously learning, you can transform raw data into actionable insights. Remember, the key is consistency, hands-on practice, and curiosity. The more you experiment with data, the more confident and skilled you’ll become.
With dedication, anyone can become proficient in data analytics and open doors to a wide range of career opportunities in this rapidly growing field.