If you are just stepping into the world of data, the idea of data analytics for beginners might seem overwhelming. But don’t worry—data analytics is simply the process of examining raw data to discover patterns, trends, and insights that can guide better decisions. In today’s digital era, businesses, governments, and organizations rely on data for almost everything—from understanding customer behavior to improving operations. Learning the basics of data analytics can open doors to career opportunities, enhance decision-making skills, and improve your problem-solving abilities.
In this guide, we will explore data analytics for beginners in a structured way, covering everything from concepts and tools to actionable steps, challenges, and practical tips.
What is Data Analytics?
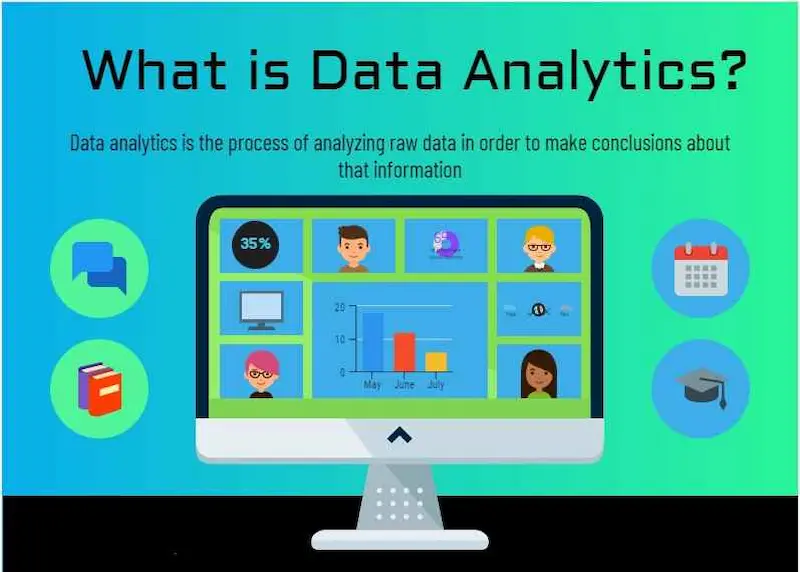
At its core, data analytics is the art and science of interpreting data. It’s about transforming raw data into meaningful insights. For example, a company might analyze customer purchase data to determine which products are popular, identify trends, or predict future demand.
Think of data analytics as detective work: the data are your clues, and your goal is to solve a mystery—understanding the story behind the numbers.
Why Learn Data Analytics?
Understanding data analytics can benefit you in multiple ways:
- Better Decision-Making – Data-driven insights allow you to make informed decisions rather than relying on guesswork.
- High-Demand Skill – Professionals skilled in analytics are highly sought after in industries like finance, marketing, healthcare, IT, and e-commerce.
- Efficiency and Optimization – Analytics helps identify inefficiencies and improve business processes.
- Predictive Power – By studying historical trends, you can anticipate future events and take proactive steps.
- Competitive Advantage – Businesses that use data effectively stay ahead of competitors.
Even as a beginner, learning the fundamentals of analytics can give you a competitive edge in your career and personal projects.
Key Concepts in Data Analytics for Beginners
Before diving into tools and techniques, it’s important to understand the main concepts of data analytics:
1. Data Types
- Structured Data – Organized data stored in rows and columns, such as Excel sheets or databases.
- Unstructured Data – Data that is not organized in a predefined way, like emails, social media posts, videos, or images.
2. Types of Analytics
- Descriptive Analytics – Summarizes past data to answer “What happened?” Examples include sales reports, website traffic summaries, or performance dashboards.
- Diagnostic Analytics – Explores reasons behind events and trends, answering “Why did it happen?”
- Predictive Analytics – Uses historical data to forecast future outcomes, answering “What is likely to happen?”
- Prescriptive Analytics – Suggests actionable strategies based on data analysis, answering “What should we do next?”
3. Key Metrics
Beginners should familiarize themselves with basic metrics:
- Mean, Median, Mode – Measures of central tendency in data.
- Variance and Standard Deviation – Measure the spread of data.
- Correlation – Shows the relationship between two variables.
Understanding these concepts helps beginners analyze data more confidently.
Tools for Data Analytics Beginners
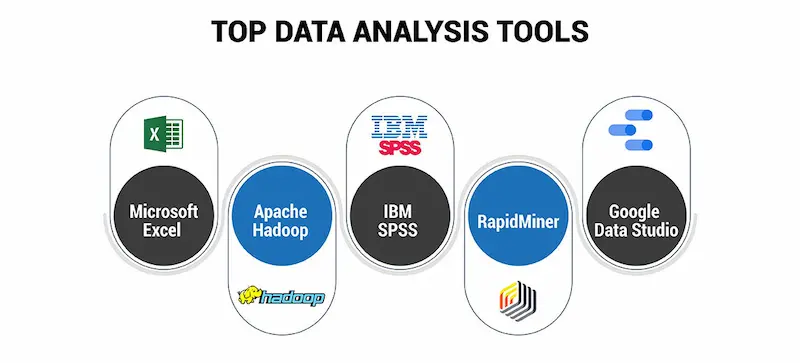
You don’t need to be a programming expert to start analyzing data. Here are beginner-friendly tools:
1. Microsoft Excel
- Ideal for small datasets and simple analytics.
- Use pivot tables, charts, and formulas to summarize and visualize data.
2. Google Sheets
- Free alternative to Excel with collaboration features.
- Supports basic analytics functions and chart creation.
3. Tableau Public
- User-friendly visualization tool for creating interactive dashboards.
- Helps beginners understand trends and communicate insights visually.
4. Power BI
- Microsoft’s analytics tool for business intelligence.
- Converts data into interactive reports and dashboards.
5. Python or R (Optional for Coding)
- For those interested in programming, Python and R are powerful for statistical analysis, machine learning, and handling large datasets.
- Libraries like Pandas, Matplotlib, and Seaborn in Python simplify data manipulation and visualization.
Steps to Start Data Analytics for Beginners
Here’s a practical roadmap to get started:
Step 1: Learn the Basics of Data
- Understand types of data, key metrics, and simple statistics.
- Familiarize yourself with charts, graphs, and tables.
Step 2: Practice with Real Data
- Use free datasets from Kaggle, Google Dataset Search, or government open data portals.
- Start small, analyze trends, and explore patterns.
Step 3: Visualize Your Data
- Create charts like bar graphs, line graphs, pie charts, and scatter plots.
- Visualization helps you understand data at a glance and communicate insights effectively.
Step 4: Perform Analysis
- Ask questions like: Which products sold the most? Which months had the highest sales? Why did traffic drop in July?
- Try simple techniques like sorting, filtering, and basic formulas before moving to advanced analytics.
Step 5: Share Your Insights
- Present your findings in a clear and concise way.
- Use dashboards or slides to communicate your results effectively.
You may also like to read this:
Complete Basic Data Analytics Tutorial To Learn Data Easily
How To Start Data Analytics | Beginner-Friendly Guide 2026
Data Analytics Tools For Beginners | Complete Guide
Simple Data Analysis Techniques For Beginners | Easy Guide
Common Challenges for Beginners
While learning data analytics for beginners, you may face some obstacles:
- Data Overload – Large datasets can be overwhelming. Start small and gradually increase complexity.
- Messy Data – Missing or incorrect values are common. Learn basic data cleaning techniques.
- Analysis Paralysis – Avoid getting stuck trying to do everything perfectly. Focus on discovering insights.
- Technical Skills – Tools like Python or R have a learning curve. Begin with Excel or Tableau if coding feels intimidating.
With practice and patience, these challenges become manageable.
Tips for Beginners
- Start Small – Practice on small datasets before attempting complex analyses.
- Focus on Storytelling – Data analytics is about insights, not just numbers.
- Learn by Doing – Hands-on experience is more effective than just theory.
- Join Communities – Online forums, blogs, and LinkedIn groups are excellent sources for guidance and feedback.
- Keep Up with Trends – Analytics tools and techniques are constantly evolving, so continuous learning is important.
Recommended Resources for Beginners
- Books – “Data Analytics Made Accessible” by Anil Maheshwari, “Storytelling with Data” by Cole Nussbaumer Knaflic.
- Online Courses – Coursera, Udemy, and LinkedIn Learning offer beginner-friendly analytics courses.
- Practice Platforms – Kaggle, DataCamp, and Google’s free analytics courses.
Conclusion
Learning data analytics for beginners is both exciting and rewarding. By understanding basic concepts, practicing with real data, using beginner-friendly tools, and gradually exploring advanced techniques, anyone can become proficient in data analytics.
Remember, data analytics is not just about numbers—it’s about making sense of the world and turning information into actionable insights. Start small, stay consistent, and soon you’ll gain the confidence to analyze data like a pro.
FAQs on Data Analytics for Beginners
1. What is data analytics in simple terms?
Answer: Data analytics is the process of examining raw data to find trends, patterns, and insights. It helps people and businesses make informed decisions. Think of it as turning numbers into meaningful information.
2. Do I need to know coding to start data analytics?
Answer: No. Beginners can start with tools like Microsoft Excel, Google Sheets, Tableau, or Power BI. Coding languages like Python or R are helpful for advanced analytics, but they are not required at the start.
3. What skills do I need as a beginner in data analytics?
Answer: Some essential beginner skills include:
Basic statistics (mean, median, mode, percentages)
Data visualization (charts, graphs, dashboards)
Data cleaning and organization
Analytical thinking and curiosity
4. Which tools are best for data analytics beginners?
Answer: Beginner-friendly tools include:
Microsoft Excel and Google Sheets
Tableau Public
Power BI
Python or R (optional for coding enthusiasts)
5. How can I practice data analytics as a beginner?
Answer: You can practice using free datasets from websites like Kaggle, Google Dataset Search, or government open data portals. Start by analyzing small datasets, creating charts, and finding patterns.