Welcome! If you’re here, you probably want to understand data better and learn how to use it effectively. This basic data analytics tutorial is designed for absolute beginners, walking you step by step through the essentials. Whether you’re a student, professional, or someone curious about numbers, by the end of this guide, you’ll have a solid foundation in data analytics and feel confident exploring it further.
What is Data Analytics?
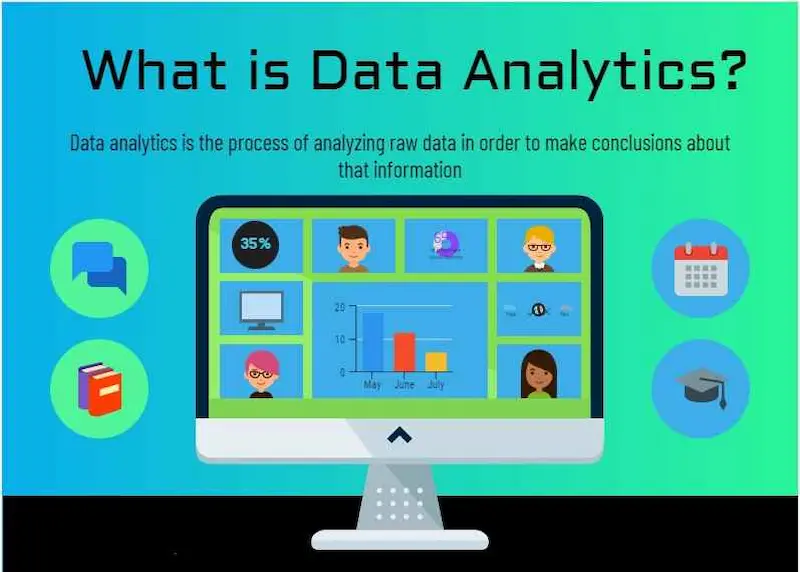
In simple terms, data analytics is the process of examining raw data to find meaningful insights. Think of it like solving a mystery—data is the clue, and analytics is how you put it all together to understand patterns, trends, and relationships.
Data analytics is used everywhere: companies use it to improve marketing, boost sales, or optimize operations; scientists use it to analyze experiments; even everyday apps use it to recommend music, movies, or products.
There are three main types of data analytics you should know:
- Descriptive Analytics – This answers the question: “What happened?”
Example: Your online store sold 500 items last month. - Predictive Analytics – This answers: “What might happen?”
Example: Based on trends, sales are expected to increase by 10% next month. - Prescriptive Analytics – This answers: “What should we do?”
Example: Offer a 10% discount on top-selling products to increase revenue.
Understanding these three types will help you apply data analytics in the right way for your goals.
Why Data Analytics is Important
Learning data analytics isn’t just a trendy skill—it’s a career-boosting tool and a practical life skill. Here’s why it matters:
- Better Decision-Making: Instead of guessing, decisions are based on facts.
- Problem-Solving: Identify patterns and solve issues efficiently.
- Career Growth: Jobs in data analytics, business intelligence, and data science are in high demand.
- Understanding Trends: From social media performance to sales growth, analytics helps spot opportunities early.
Even if your role isn’t technical, understanding analytics gives you a competitive edge.
Tools You Can Use for Data Analytics
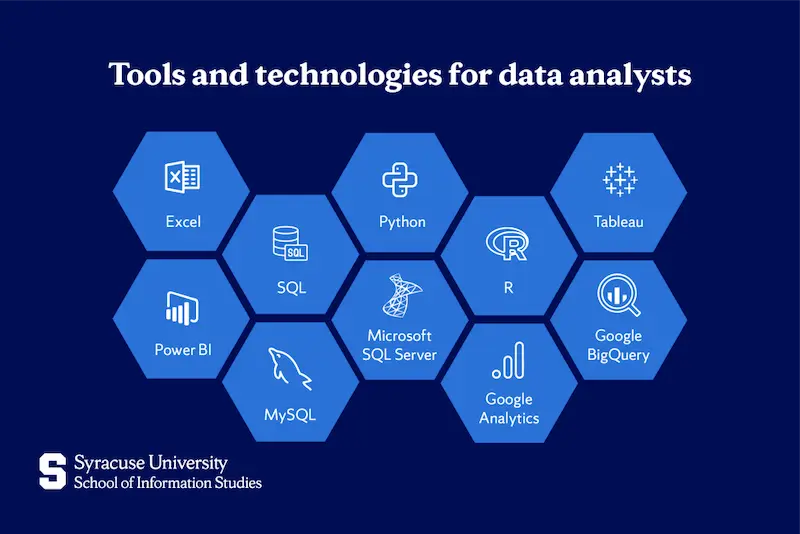
You don’t need to be a tech wizard to get started. Here are beginner-friendly tools:
1. Microsoft Excel
Excel is a powerhouse for beginners. You can organize data, use formulas, create pivot tables, and visualize trends with charts.
2. Google Sheets
Similar to Excel but cloud-based. Great for collaboration and sharing data in real-time.
3. Tableau
Tableau is perfect for creating interactive visualizations. Drag and drop data to see insights instantly.
4. Power BI
Microsoft Power BI is another business intelligence tool. It’s great for creating dashboards and reporting insights to teams.
5. Python & R
Programming languages like Python and R are for advanced analytics. They allow handling larger datasets and performing complex analyses. Beginners can start with simple scripts in Python using libraries like pandas and matplotlib.
Step-by-Step Guide to Basic Data Analytics
Here’s a simple roadmap you can follow:
Step 1: Define Your Goal
Always ask: “What am I trying to learn?” A clear goal keeps your analysis focused. For example: “Which product sold the most last quarter?”
Step 2: Collect Data
Gather data from reliable sources: Excel sheets, CSV files, surveys, Google Analytics, or open datasets online.
Step 3: Clean Your Data
Raw data often has errors, missing values, or duplicates. Cleaning your data is crucial to ensure accurate results. Example: Remove empty rows, correct typos, standardize date formats.
Step 4: Explore and Analyze Data
Look for patterns using:
- Sorting and filtering in Excel or Sheets
- Pivot tables to summarize data
- Charts and graphs to visualize trends
This stage is where insights begin to emerge.
Step 5: Visualize Data
Visualization makes data easier to understand. Use:
- Bar charts for comparisons
- Line charts for trends over time
- Pie charts for proportions
- Dashboards for interactive summaries
Tools like Tableau and Power BI are excellent for creating visuals that tell a story.
Step 6: Interpret Results
After analyzing, ask yourself: “What does this data mean?” Then decide on actions. Example: If sales for a product dropped, maybe it’s time for a marketing campaign.
Step 7: Communicate Insights
Analytics isn’t just about finding insights—it’s about sharing them. Summarize your findings clearly for your team, manager, or audience.
You may also like to read this:
Learn Data Analytics For Beginners: Easy Tips And Tools
How To Start Data Analytics | Beginner-Friendly Guide 2026
Data Analytics Tools For Beginners | Complete Guide
Simple Data Analysis Techniques For Beginners | Easy Guide
Tips for Beginners
- Start with small datasets to practice before moving to large ones.
- Learn one tool at a time. Excel is easiest for beginners.
- Focus on patterns and trends, not just numbers.
- Work on real-world projects, like sales reports or survey data, to gain practical experience.
- Take online courses or tutorials—many free resources exist for beginners.
FAQs: Basic Data Analytics Tutorial
Q1: Do I need coding skills for data analytics?
Not for basic analytics. Tools like Excel, Google Sheets, Tableau, and Power BI are enough. Coding is helpful for more advanced tasks.
Q2: How long will it take to learn basic data analytics?
With consistent practice, you can master the basics in 4–6 weeks.
Q3: Can data analytics help in non-technical roles?
Yes! Marketing, HR, operations, and finance all benefit from analytics. Understanding trends and patterns helps you make smarter decisions.
Q4: Are free online resources enough for beginners?
Absolutely! Websites, tutorials, and YouTube channels offer hands-on exercises to learn effectively.
Next Steps
Once you’ve mastered the basics, you can move to:
- Advanced Excel techniques (macros, advanced formulas)
- Python or R for larger datasets
- Predictive analytics using machine learning
- Building interactive dashboards with Tableau or Power BI
Conclusion
This basic data analytics tutorial is your first step into a world where data drives smarter decisions. Start small, practice regularly, and explore tools and techniques at your own pace. Remember, analytics is not just about numbers—it’s about understanding patterns, telling stories, and making informed decisions.
By following this guide, you’ll gain the confidence to dive deeper into data analytics and use it in your personal projects, studies, or career.